A spreadsheet can look perfectly fine and still have problems hiding underneath: inconsistent dates, duplicate orders, missing values, or formulas that return a number but calculate the wrong thing.
Claude for Excel lets you work through those issues directly inside your workbook. You can ask it to clean data, check formulas, create reports, and explain what the numbers mean, all from a sidebar in Excel.
We’ll use sales data from the Kevin Cookie Company to go from a messy worksheet to a report with charts, pivot tables, and business insights. If you’d like to follow along, download the sample Excel workbook.
This tutorial is sponsored by Anthropic, the team behind Claude.
What You'll Learn
- Install the Claude add-in and open its Excel sidebar with Ctrl + Alt + C.
- Clean inconsistent data while reviewing duplicate deletions, inferred values, and flagged corrections.
- Validate formula logic to catch incorrect calculations that still return plausible numbers.
- Create sales summaries, charts, pivot tables, and business insights through natural-language prompts.
Table of Contents
- 1. Install Claude for Excel
- 2. Clean and Standardize Your Excel Data
- 3. Validate and Fix Excel Formulas
- 4. Create a Sales Summary and Charts
- 5. Analyze the Data and Find Business Insights
- 6. Explore Custom Instructions, Connectors, and Skills
- From Messy Data to a Useful Excel Report
1. Install Claude for Excel
Getting Claude set up in Excel only takes a few steps:
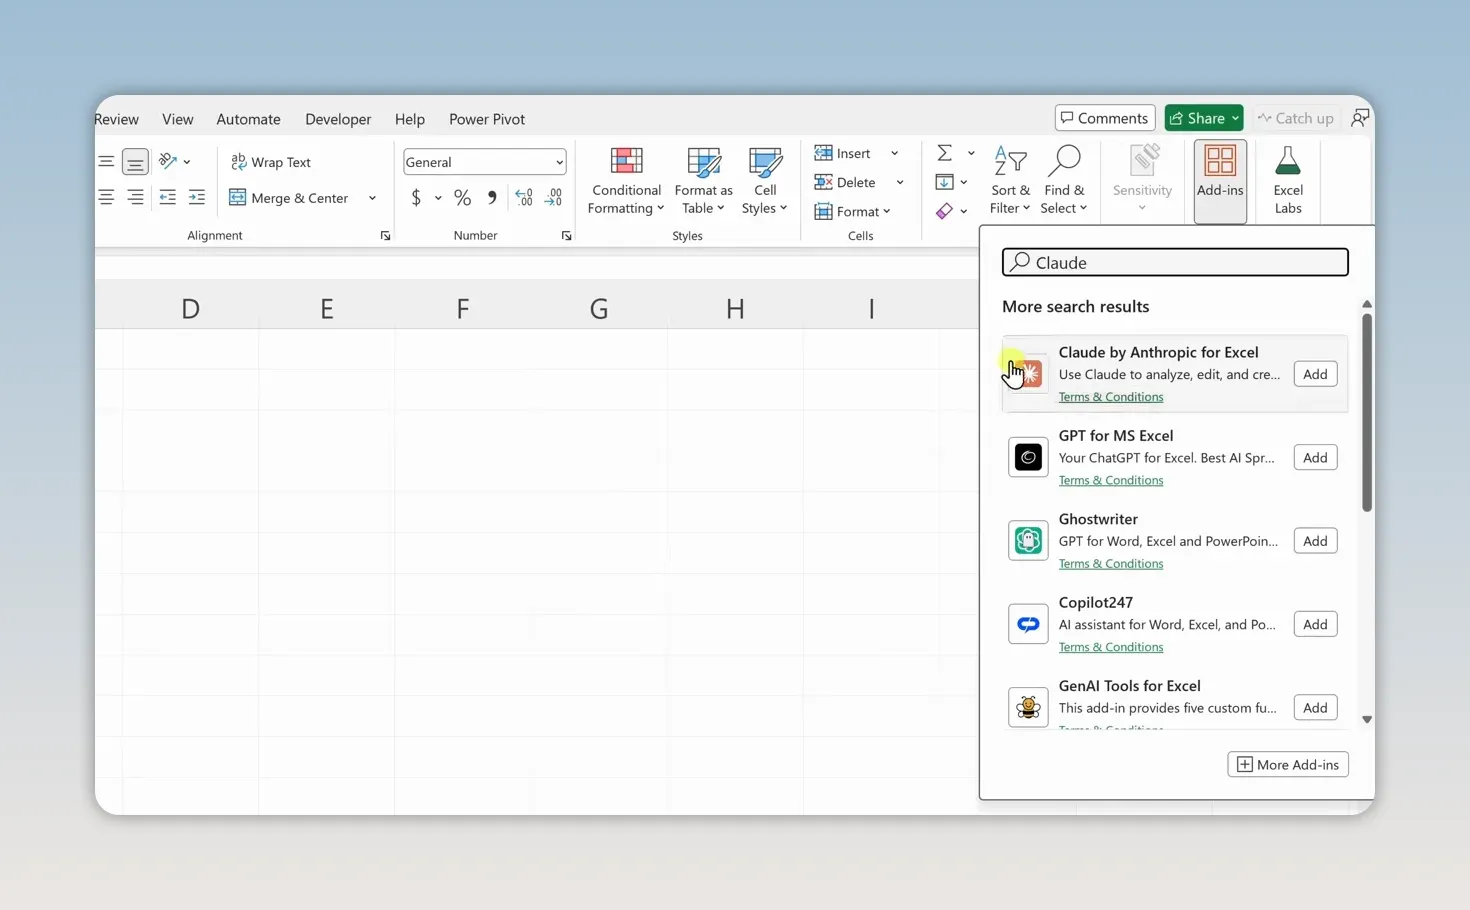
- Open Microsoft Excel and select the Home tab.
- On the right side of the ribbon, click Add-ins.
- Search for Claude.
- Find the Claude add-in in the results and click Add.
- Once the sidebar opens, sign in to your Claude account or create an account.
Claude for Excel requires a paid Claude plan. It does not work with the free version.
Open the Claude sidebar
You have two ways to open Claude after installation:
- Press Ctrl + Alt + C.
- Click the Claude icon on the Excel ribbon.
The first time you use the keyboard shortcut, Excel may say that multiple features use the same shortcut. Choose the option to show the Claude sidebar, then click OK.
If the shortcut doesn’t open Claude, you can reset its assignment:
- Click the search field at the top of Excel.
- Search for Reset Office Add-in Shortcut Preferences.
- Select the matching command.
- Press Ctrl + Alt + C again and assign it to the Claude sidebar.
With the sidebar open, the prompt field at the bottom is where you tell Claude what you want it to do.
2. Clean and Standardize Your Excel Data
The sample sales worksheet has several problems that are easy to recognize but tedious to fix individually:
- Order dates use inconsistent formats, and some dates need closer review.
- A customer name is missing.
- Product names and sales rep names use inconsistent capitalization.
- An order appears twice.
- A quantity is missing.
- The Total column contains fixed values rather than formulas.
A duplicate order alone could throw off the sales report. Before building anything on top of this data, we want to get the underlying records into better shape.
Select the data and give Claude a cleanup task
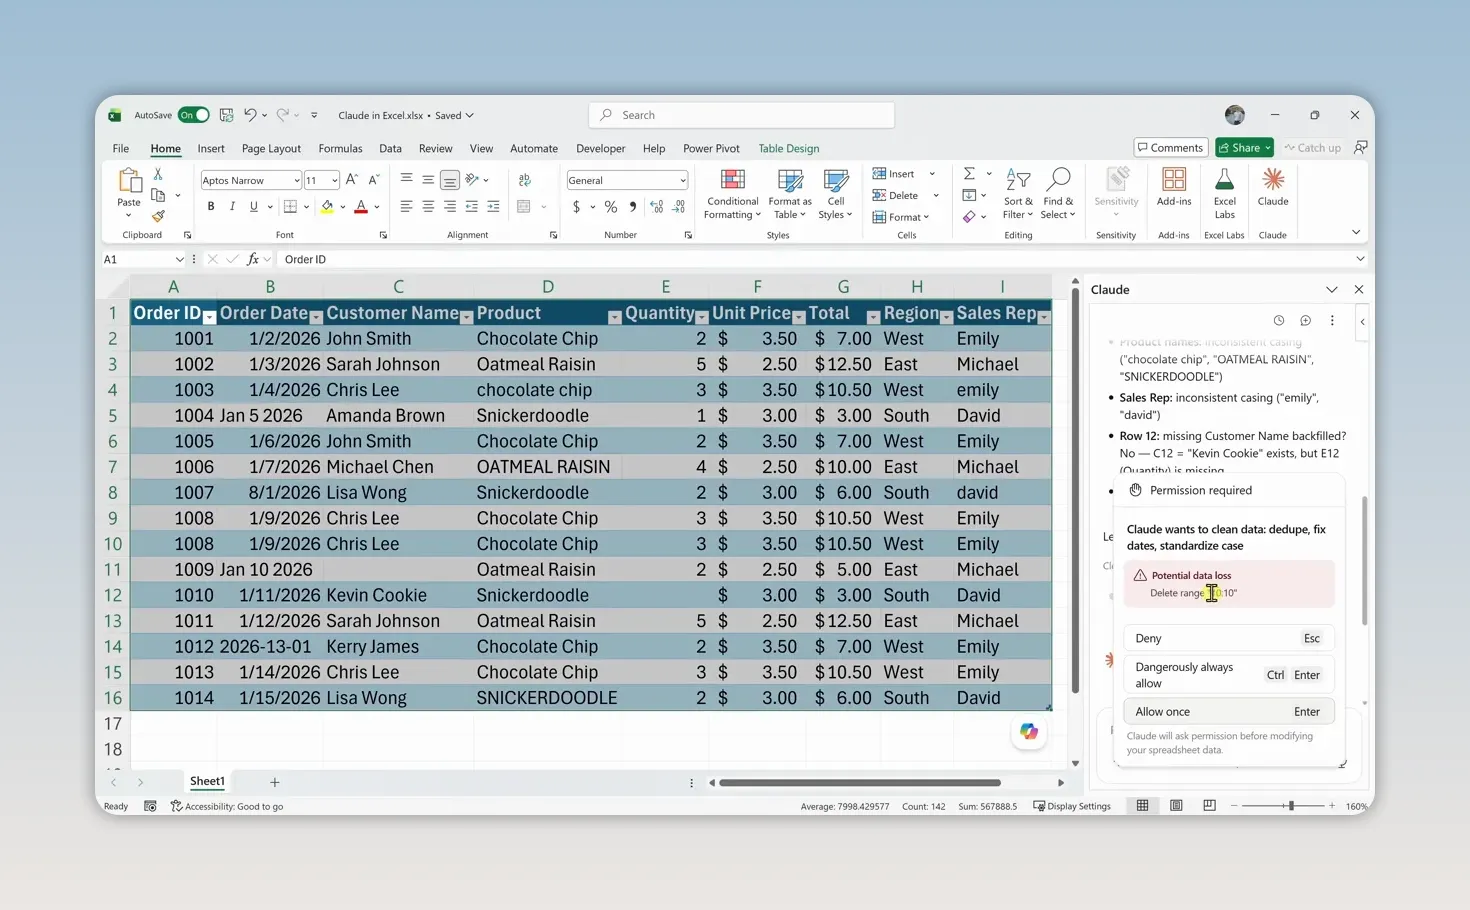
Highlight the entire sales dataset, then press Ctrl + Alt + C. The sidebar shows the selected range so you can see what Claude will work on.
Enter a prompt such as:
Clean this dataset by making the date formats consistent, removing duplicate records, and correcting obvious data issues.
Send the request. Claude begins inspecting the worksheet and working through the issues.
Review requests to delete data
In this example, Claude identifies row 10 as a duplicate and asks permission to delete it. Check the row yourself before clicking Allow.
That approval step is useful. Claude asks before making destructive changes such as deleting the duplicate row, giving you a chance to confirm that the proposed change makes sense.
Inspect the cleanup results and flagged cells
Once Claude finishes, review its explanation in the sidebar. It lists the issues it found and the changes it made. The worksheet now has consistent date formatting and cleaner customer, product, and sales rep names.
Some changes also have comments attached to the relevant cells. These deserve attention because they involve an interpretation or an inferred value.
For example, one date was entered as 8/1. Based on the surrounding sequence of dates, Claude interpreted it as 1/8, made the correction, and flagged it for review. It also flagged invalid-date issues rather than treating every date correction as certain.
A suggested correction still needs your judgment. The helpful part is that you can see which changes require a closer look.
The missing customer name stays blank. That makes sense: there isn’t enough information for Claude to know who the customer was. You’ll need to supply that name yourself.
The missing quantity is different. Claude can infer it from the unit price and order total, so it fills in the value and flags the inference.
Replace fixed totals with formulas
Claude also improves the Total column. Originally, the totals were hard-coded numbers. Changing a quantity would not change the corresponding total.
After cleanup, the totals use formulas that multiply Quantity by Unit Price. Change a quantity from two to three, and the total updates automatically. Change it back, and the total recalculates again.
That’s more useful than simply making the worksheet look cleaner. The data now behaves the way you’d expect a spreadsheet to behave.
3. Validate and Fix Excel Formulas
A formula doesn’t have to display an error to be wrong.
To test this, I changed one of the order totals from Quantity × Unit Price to Unit Price × Unit Price. Excel still returned a number. At a glance, the column looked normal, but the calculation was incorrect.
To have Claude check the formulas:
- Select the entire sales dataset again.
- Open the Claude sidebar.
- Ask Claude to inspect the formulas and correct any issues.
Check the formulas in this sheet for errors or inconsistent logic, and fix any problems you find.
In the sample workbook, Claude catches the altered formula and restores it to Quantity multiplied by Unit Price. Click the corrected cell and inspect the formula bar to confirm the change.
This is a useful second pass after cleaning the data. Consistent formatting and correct calculation logic are two separate checks. A worksheet can pass one and still fail the other.
4. Create a Sales Summary and Charts
With the data cleaned and the formulas checked, we can build a report without starting from a blank worksheet.
Open Claude and enter a request like this:
Summarize total sales by product and by region, and create charts to visualize both summaries.
Claude creates a product summary, a regional summary, and associated charts directly in Excel.
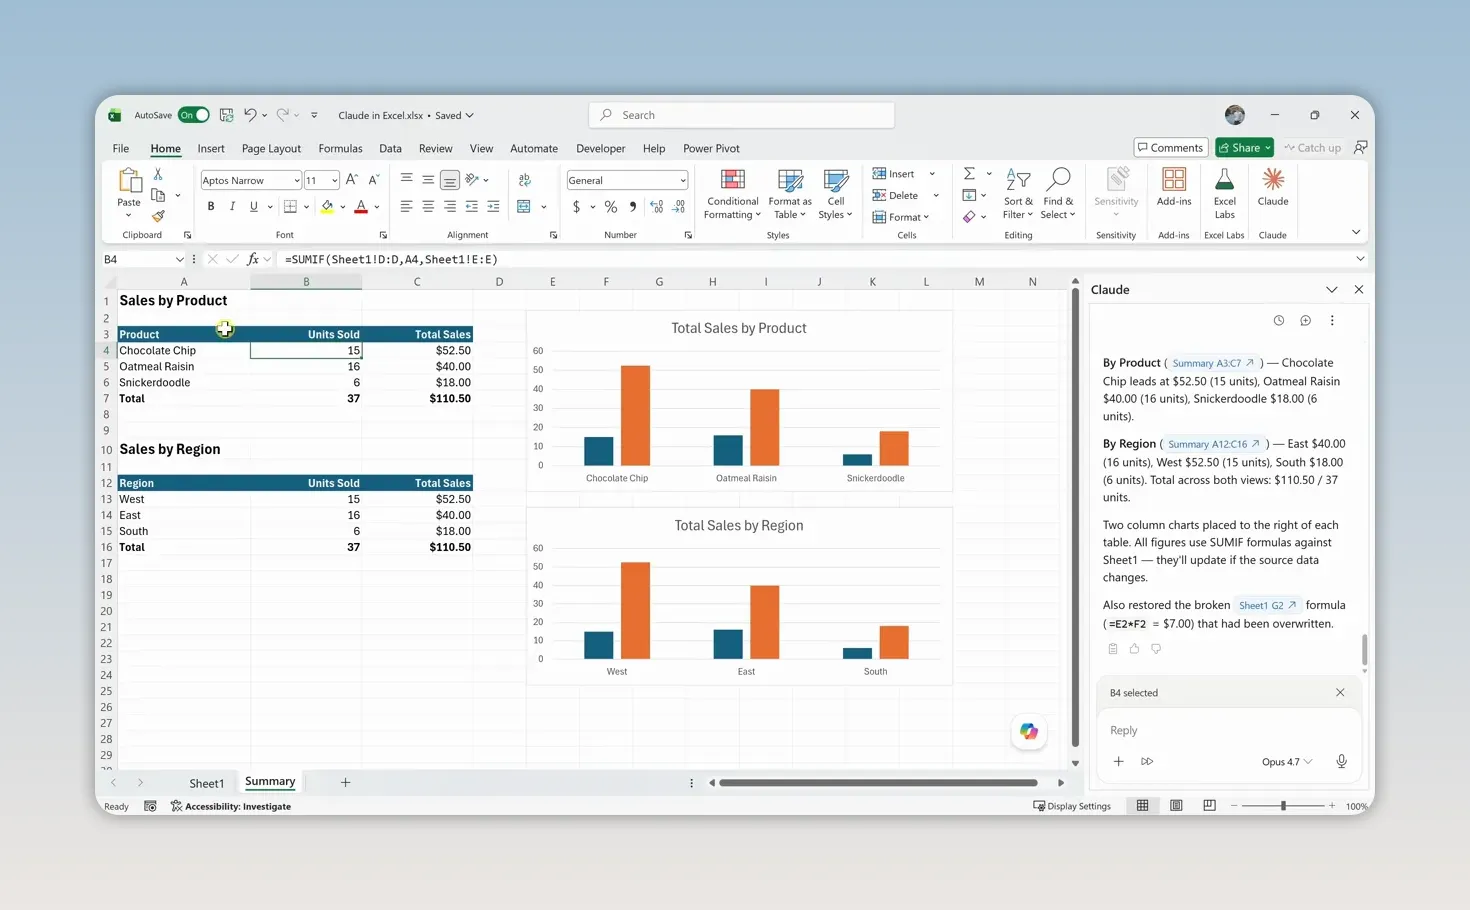
The useful detail here is how the report is built. Click a summary value, and you can see a formula that refers back to the source data on the first sheet.
That means the initial report is not just a collection of copied numbers. Changes to the referenced sales data flow through to the formula-based summary and its charts.
Convert the report to pivot tables
Personally, I prefer pivot tables because I find them more flexible. You don’t have to start over to make that change. Just continue the conversation with Claude:
Convert these summaries into pivot tables instead.
Claude may ask how you’d like to arrange them. In this example, choose two separate pivot tables: one for the product view and one for the regional view.
It then asks permission to replace the existing report content. Review the request and click Allow to proceed.
The result is a product pivot table, a regional pivot table, and associated pivot charts.
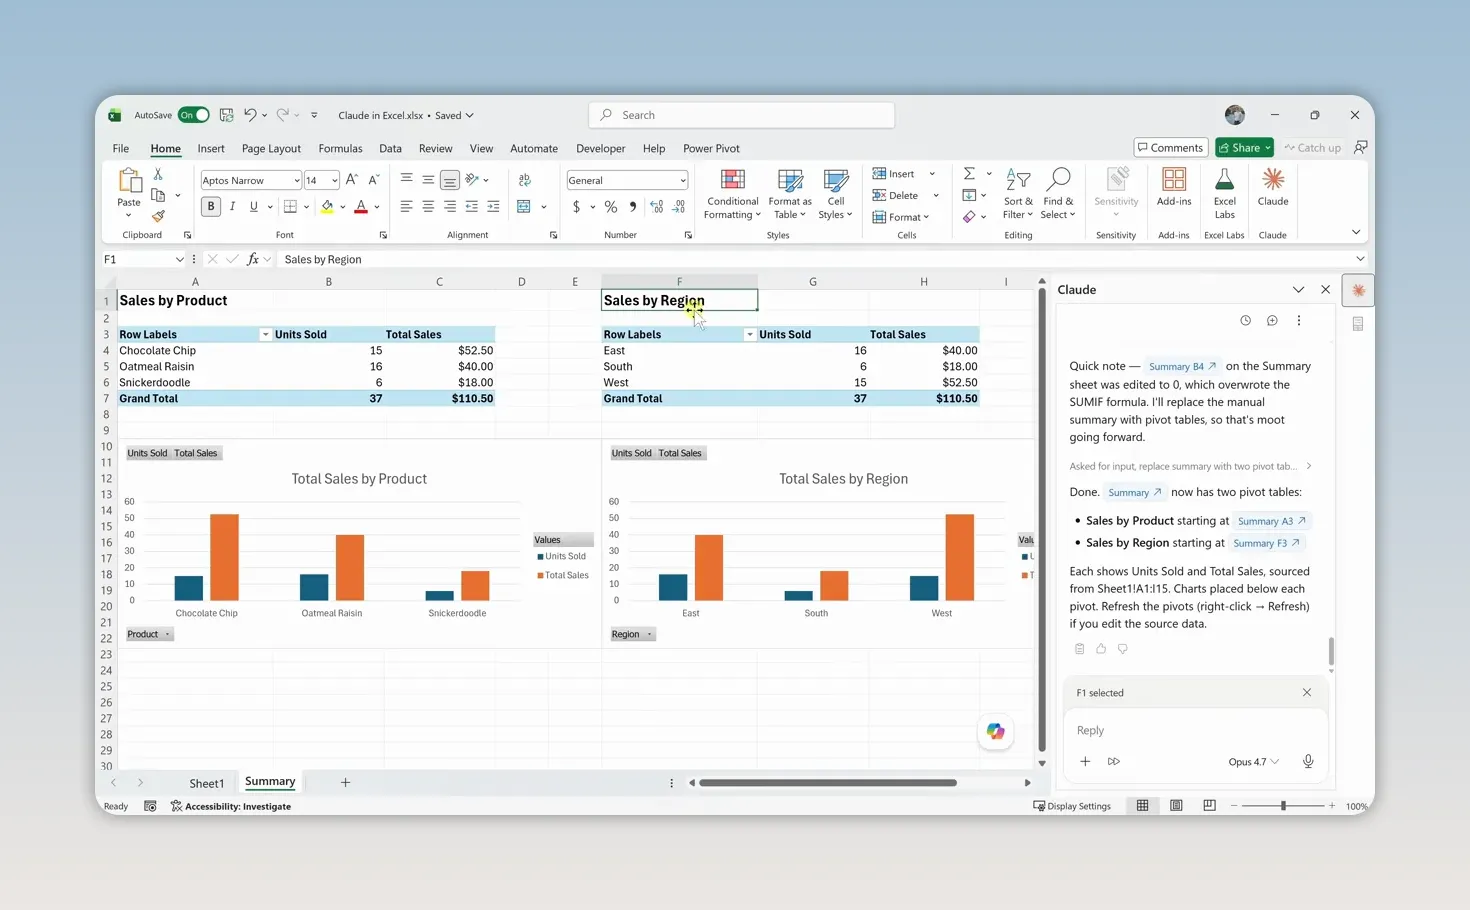
This is where follow-up prompts come in handy. Your first request gets a report built, and the next request adjusts it to the format you prefer. You can keep refining the result rather than trying to describe every detail in one prompt.
If pivot tables are new to you, Microsoft’s guide to creating a PivotTable provides additional background on working with them in Excel.
5. Analyze the Data and Find Business Insights
A report makes the numbers easier to see. The next step is understanding what those numbers tell you.
Open Claude and ask:
Analyze the sales data and identify the main trends, best-performing products, and other notable patterns.
Claude summarizes its findings in the sidebar, including information about the product mix and relative product performance.
In the sample data, Chocolate Chip sells the most, while Snickerdoodle sells the least. Claude also adds a set of key metrics to the summary sheet, making it easier to review the findings alongside the report.
You can use the sheet reference in Claude’s response to jump to the summary. From there, continue asking follow-up questions if you want to explore a finding more closely.
The workflow now goes beyond spreadsheet cleanup: you’ve moved from raw records to a report, then from that report to an explanation of what’s happening in the business.
6. Explore Custom Instructions, Connectors, and Skills
The basic prompts already do quite a bit, but Claude for Excel also includes features for recurring preferences and more specialized work.
Custom instructions
Click the three-dot menu at the top of the Claude sidebar, then open Settings to enter custom instructions.
For example, if you always want numbers formatted with a thousands separator, you can set that preference once instead of repeating it in each request.
Connectors
Click the plus icon near the prompt field to access connectors. These let you bring in external data from sources such as FactSet and Moody’s.
Built-in skills
Skills are prebuilt workflows you can trigger with a command. Instead of describing a task from scratch, you can choose a skill designed for that type of work, such as data cleanup.
You can add a skill through the sidebar or type a forward slash (/) in the prompt field to see your available skills.
You don’t need to start with these advanced features. Simple requests are enough to clean a dataset, validate formulas, build a report, and generate insights. Custom instructions, connectors, and skills give you additional options as your workflow becomes more specialized.
From Messy Data to a Useful Excel Report
The most practical way to use Claude for Excel is in stages: clean the data, check the calculations, build the report, then analyze the results.
At each stage, review what changed. Confirm deletions, inspect flagged assumptions, fill in information Claude cannot know, and check corrected formulas. Claude handles much of the repetitive work while you stay involved in the decisions that matter.
With that approach, a messy worksheet can become a cleaner, more useful workbook without leaving Excel.


