An Excel sales dashboard can bring your key metrics, charts, and filters together in one place. But building all of that manually takes work. With Microsoft Copilot, you can describe the dashboard you want and let it handle the initial build, including the layout and formatting.
We’ll use sales data from my small business, the Kevin Cookie Company, to create an interactive dashboard, explore sales performance, verify the numbers, customize the design, and test what happens when a new order comes in.
What You'll Learn
- Use Copilot’s Allow Editing mode to create an interactive sales dashboard from workbook data.
- Combine dashboard filters to explore sales, then verify revenue against the original fulfilled orders.
- Customize the dashboard through follow-up prompts and test automatic updates by adding a new order.
Table of Contents
- 1. Open Your Sales Data and Check Copilot Access
- 2. Ask Copilot to Build the Dashboard
- 3. Explore the Sales Metrics and Charts
- 4. Use Interactive Filters to Explore Your Data
- 5. Verify the Dashboard’s Results
- 6. Customize the Dashboard’s Theme
- 7. Add a New Order and Test Automatic Updates
- From Sales Data to an Interactive Dashboard
1. Open Your Sales Data and Check Copilot Access
The sample workbook contains 500 orders from the past year, with details including cookie type, quantity, price, order date, order status, and sales region. That gives us plenty to work with, from monthly revenue trends to our most popular cookies.
You can follow along with the sample Excel workbook, or use your own sales data.
You’ll need access to Copilot in Excel. I’m using Microsoft 365 Family for this example, but the features available to you may vary depending on your subscription. Microsoft’s Copilot in Excel overview provides additional product information.
2. Ask Copilot to Build the Dashboard
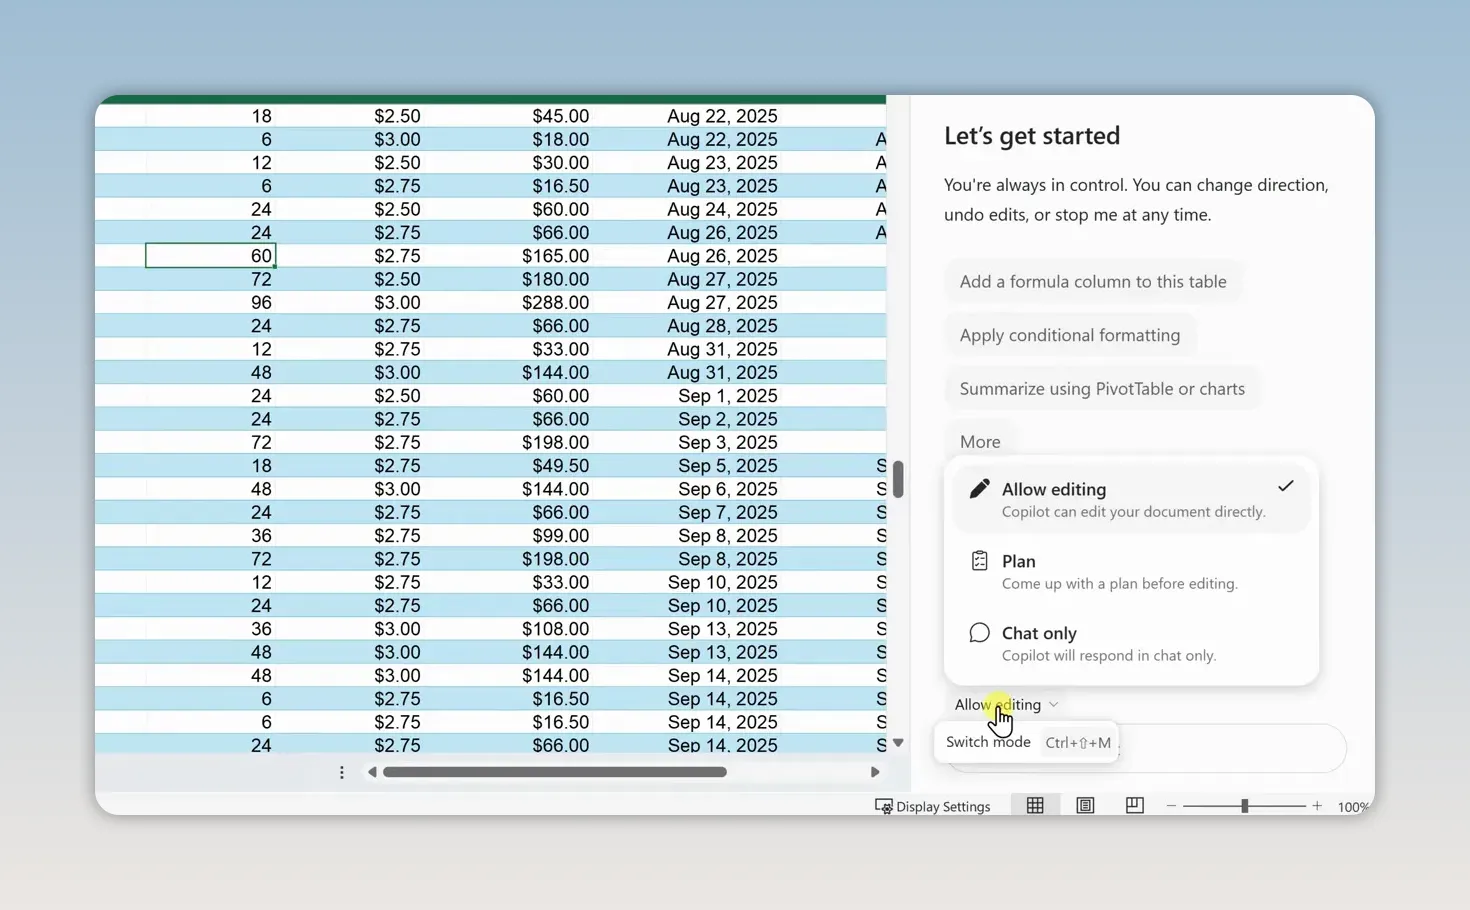
With the workbook open, select the Copilot icon in the bottom-right corner. Before entering your request, check the mode near the prompt field.
In the interface used here, you have three options:
- Allow Editing: Lets Copilot make changes directly to the workbook.
- Plan: Lets you review what Copilot intends to do first.
- Chat Only: Lets you ask questions without changing the workbook.
Because we want Copilot to create the dashboard rather than simply explain how to build one, select Allow Editing.
Enter the following prompt and submit it:
Create a professional, interactive sales dashboard using the data in this workbook. Include key sales metrics, charts showing sales trends and performance, and interactive filters so I can explore the data. Put everything on a new worksheet.
This gives Copilot a clear goal, identifies the source data, and specifies the main components we need. It also tells Copilot to put the dashboard on a new sheet, keeping the original order data separate.
Copilot analyzes the workbook and builds the dashboard, taking care of the charts, calculations, formatting, and layout. Instead of creating each piece individually, we now have a complete starting point from one request.
3. Explore the Sales Metrics and Charts
Across the top of the generated dashboard, Copilot places four key performance metrics. In this example, the initial results are:
- Total revenue: $41,586.
- Fulfilled orders: 424.
- Average order value: $98.08.
- Units sold: 15,252.
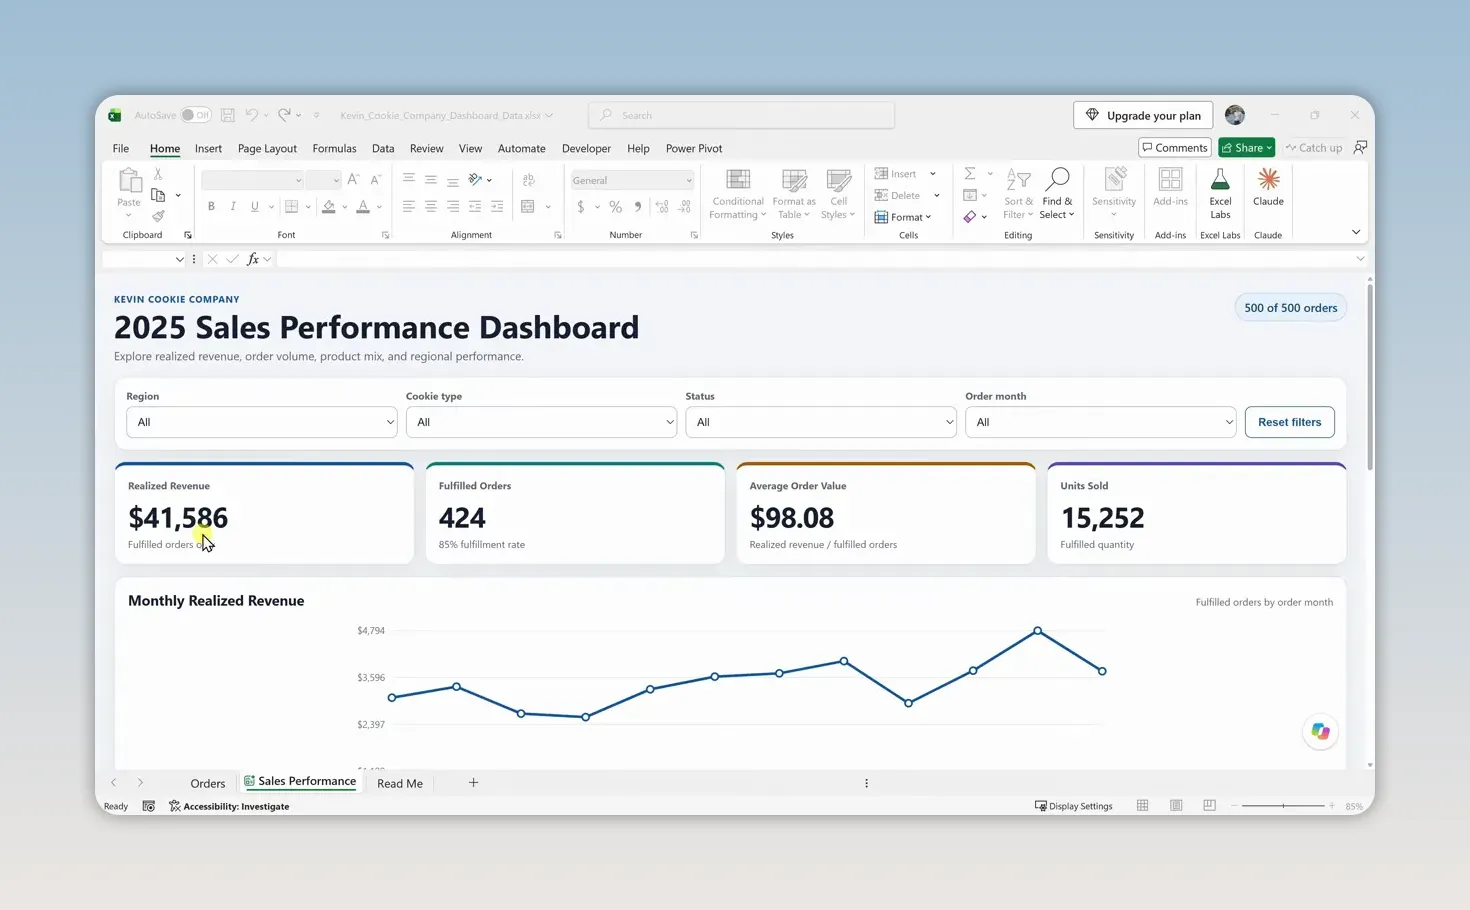
Below the metrics, the dashboard includes several ways to explore performance:
- Monthly sales trends show how revenue changes throughout the year.
- Revenue by cookie type compares sales across products.
- Revenue by region compares geographic performance.
- Order status mix shows the breakdown of orders by status.
- Top customers highlights the customers contributing to sales.
These views answer different questions. The monthly chart helps you spot stronger and weaker periods, while the product and region charts help explain where revenue is coming from.
One important detail: the workbook contains 500 orders, but the headline order metric counts fulfilled orders. That distinction matters when we check the calculations.
4. Use Interactive Filters to Explore Your Data
The dashboard isn’t just a collection of static charts. The filters at the top let you narrow the data, and the metrics and charts update together.
Try the same sequence I used:
- Set the Region filter to West.
- Set the Cookie Type filter to Chocolate Chip.
- Set the Month filter to December.
After the first selection, the dashboard shows sales for the West region. Adding the cookie type narrows it to chocolate chip sales in that region. Adding December narrows it again to that specific month.
The filters work together, so you can move from an overall business picture to a specific slice of sales without rebuilding a chart or calculating a new total manually.
When you want the full picture again, select Reset Filters at the top. That returns the dashboard to its original, unfiltered view.
5. Verify the Dashboard’s Results
A professional-looking dashboard is useful only if the numbers are right. Anytime you use AI to analyze data, double-check the results, especially if you’ll use them to make business decisions.
Our dashboard reports $41,586 in revenue from 424 fulfilled orders. There’s money in the cookie business! But before we celebrate, let’s compare that revenue with the original data.
- Return to the Orders worksheet.
- Select the header row of the sales data.
- Open the Data tab and turn on Filter.
- Open the filter for the order status column.
- Clear the other selections and select only Fulfilled.
- Select the first order total in the filtered results, then press Ctrl + Shift + Down Arrow to extend the selection down the order totals.
- Check the Sum on Excel’s status bar at the bottom.
For the sample data, that sum is $41,586, matching the dashboard’s revenue exactly.
This check also confirms what the revenue metric represents: revenue from fulfilled orders, rather than an indiscriminate total of every order status. Copilot got the revenue right in this case, but verification should still be part of the workflow.
6. Customize the Dashboard’s Theme
Now that we’ve checked the numbers, we can make the dashboard look more like something the Kevin Cookie Company would use.
First, there’s an important difference between this dashboard and a traditional Excel worksheet. Copilot created a different type of sheet, identified by a special icon beside its name. In this example, I can’t directly edit individual cells or drag the charts around.
Instead, we make changes by asking Copilot.
Open Copilot again and submit this prompt:
Redesign the dashboard with a modern dark theme using navy blue backgrounds, gold accents, and high-contrast white text. Keep the existing layout, charts, metrics, and interactive filters fully functional. Make sure all labels and charts remain easy to read.
The request specifies both what should change and what should stay the same. We want a new visual style, not a different dashboard or broken filters.
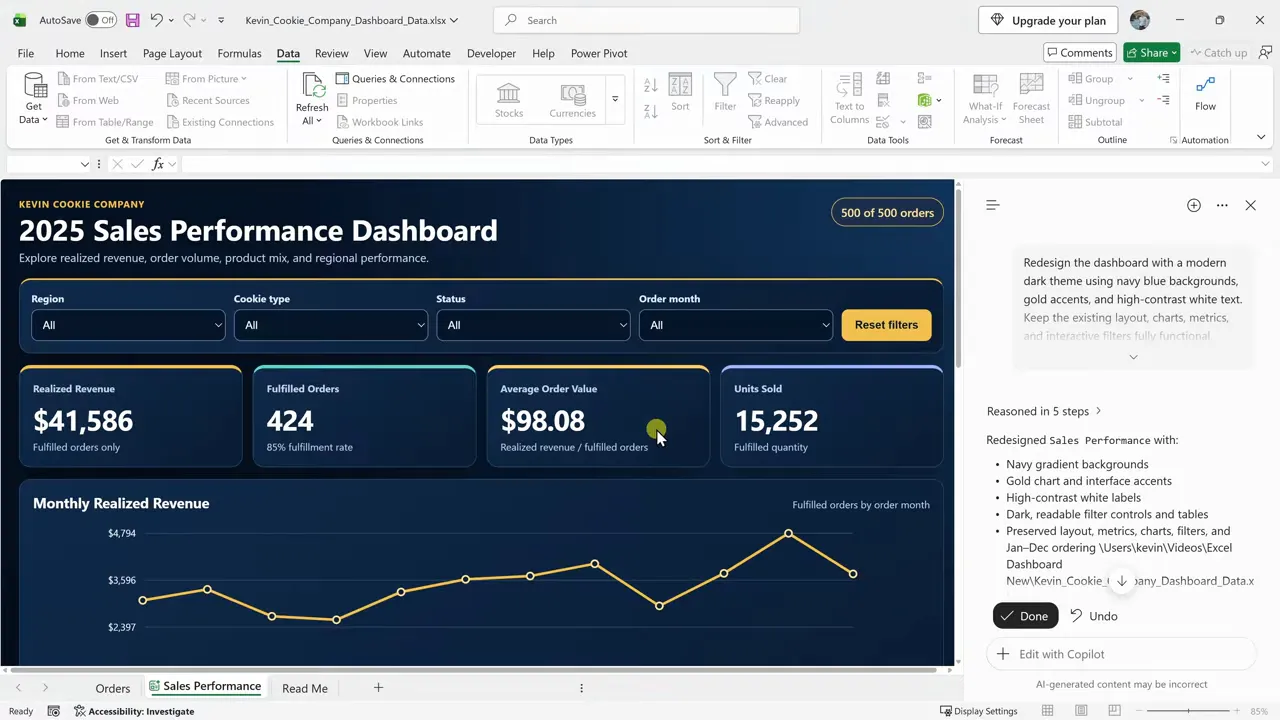
Copilot applies the dark theme while preserving the dashboard’s structure and functionality. We’ve changed the look without rebuilding the metrics, charts, or filters.
7. Add a New Order and Test Automatic Updates
The Kevin Cookie Company isn’t going to stop taking orders just because we built a beautiful dashboard. The next test is whether it keeps up with new sales.
Return to the original order data and add a new order. In this example, Microsoft places an order for 5,000 chocolate chip cookies at $2 each, giving us a $10,000 sale. What can I say? They really like our cookies.
After adding the order, return to the dashboard. In this workbook, it automatically incorporates the new data:
- Revenue increases from $41,586 to $51,586.
- Fulfilled orders increase from 424 to 425.
- Units sold increase from 15,252 to 20,252.
- The monthly revenue chart shows a large spike in December.
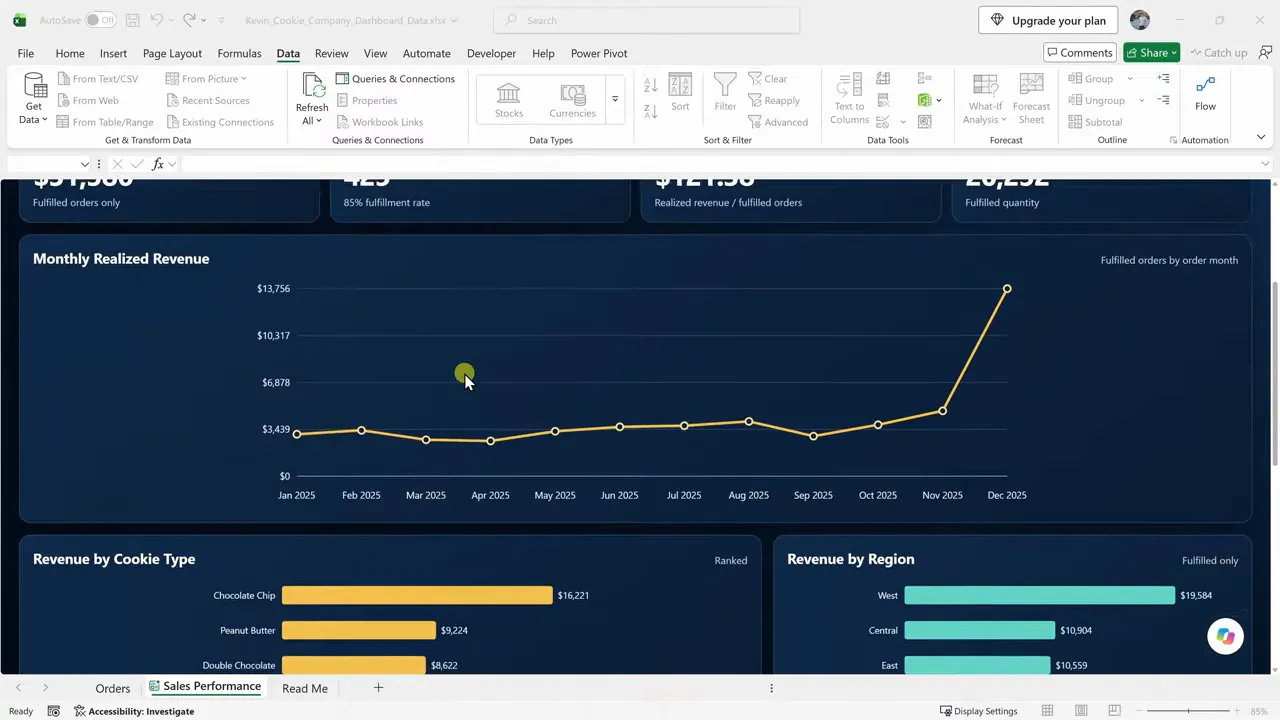
That’s the final piece: a dashboard that doesn’t just describe the original data, but continues to reflect new orders as they’re added.
From Sales Data to an Interactive Dashboard
Copilot handles much of the dashboard-building work, but you still guide the process. Describe what you need, explore the result with filters, verify the calculations, and then refine the design. Adding a test order gives you a practical way to confirm that the dashboard stays connected to the underlying data.
If you’d also like to understand how to build these components manually, my traditional Excel dashboard tutorial walks through that approach step by step.


