Organizations have a tremendous amount of data. The interesting questions are what that data tells us and what decisions we should make because of it. Microsoft Power BI helps turn rows of information into interactive reports that make those answers easier to find.
We’ll build a report for the Kevin Cookie Company using customer and order data from Excel. By the time we’re finished, we’ll have a chart showing cookies shipped over time, a card displaying total revenue, and a customer list that filters the entire report. Then we’ll publish it to the Power BI web service so we can share it with the team.
What You'll Learn
- Import Excel tables and clean their data with Power Query without modifying the original workbook.
- Connect customer and order tables so selections filter related shipment and revenue figures.
- Build an interactive report using a line chart, revenue card, and customer list.
- Publish your report to the Power BI web service for sharing and collaboration.
Table of Contents
- 1. Install Power BI Desktop
- 2. Import Excel Data into Power BI
- 3. Inspect Your Tables in Data View
- 4. Clean the Data with Power Query
- 5. Check the Relationship in Model View
- 6. Build Your Report Visualizations
- 7. Filter the Report by Customer
- 8. Rename the Report Page and Add More Pages
- 9. Publish and Share Your Power BI Report
1. Install Power BI Desktop
Open the Microsoft Store and search for Power BI. You may see several related applications, so make sure you choose Power BI Desktop. This is the application we’ll use to model data and build reports.
The Power BI application for interacting with existing reports and the separate Report Builder application are not what we need for this exercise. You can go directly to the Power BI Desktop store listing and select the installation option, or open it if it’s already installed.
When Power BI Desktop launches, the welcome screen provides shortcuts to get data, reconnect to recent data sources, and open reports. It also includes learning resources. If you don’t want this screen to appear every time, clear the checkbox at the bottom.
Close the welcome screen to enter Report view. This is the canvas where we’ll arrange our visualizations.
2. Import Excel Data into Power BI
Power BI supports many different data sources. On the Home tab, open the Get Data dropdown to see the available connections. For this report, we’ll use an Excel workbook.
To follow along with the same information, download the sample customer and order workbook.
- Choose the Excel workbook option under Get Data.
- Browse to the workbook and open it.
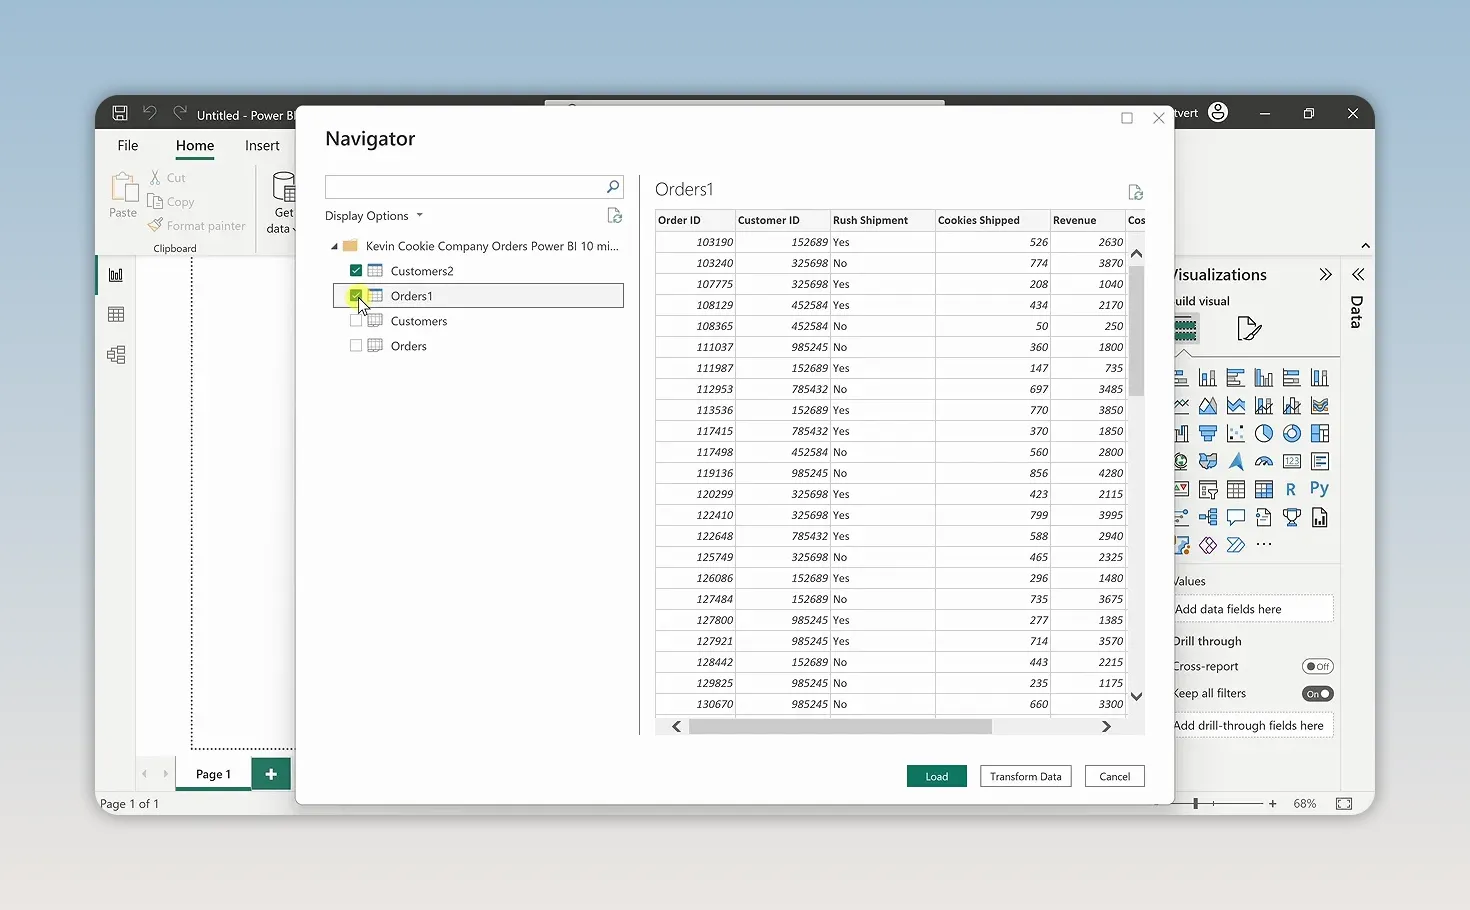
- In the Navigator, select the Customers and Orders tables.
- Click each table name to preview its contents.
The Customers table contains information about the Kevin Cookie Company’s customers. The Orders table contains their orders, including the information we’ll use to analyze shipments and revenue.
Navigator also lists the workbook’s sheets. In this example, the sheets contain the same tables, so we only need to select the two table entries.
Load or Transform Data?
At the bottom of Navigator, you have two important choices:
- Load: Bring the selected data into Power BI as it currently appears.
- Transform Data: Open the data preparation tools so you can clean or modify it before loading.
Why transform data here instead of fixing the original Excel workbook? You may not control the source. Someone else might own the spreadsheet, or the information might come from a database you can read but cannot edit.
For now, select Load. We can still return to the transformation tools later.
Once the import finishes, the pane on the right lists Customers and Orders. Expand either table to see its columns, also called fields. These are the building blocks we’ll drag into our report.
3. Inspect Your Tables in Data View
Before building charts, it’s worth checking what you’ve imported. Select Data view from the navigation on the left, then choose the Customers table.
There’s a small consistency issue in the Country column: some records use United States, while another uses US. Those labels refer to the same country, so we should standardize them.
Next, select Orders. This table includes a Rush Shipment column that we don’t need for our analysis. We’ll remove it from the data we bring into the report.
These are simple changes, but they illustrate a useful habit: inspect your data before asking your visuals to explain it.
4. Clean the Data with Power Query
Return to Report view. On the Home tab, choose Transform Data to open the Power Query Editor.
Think of Power Query as a preparation layer between your original data and your Power BI model. The changes we make here do not change the original Excel workbook.
The Queries pane on the left contains two queries, one for Customers and one for Orders.
Standardize the Country Values
- Select the Customers query.
- Scroll across to the Country column.
- Right-click the column header and select Replace Values.
- Enter US as the value to find.
- Enter United States as the replacement, then select OK.
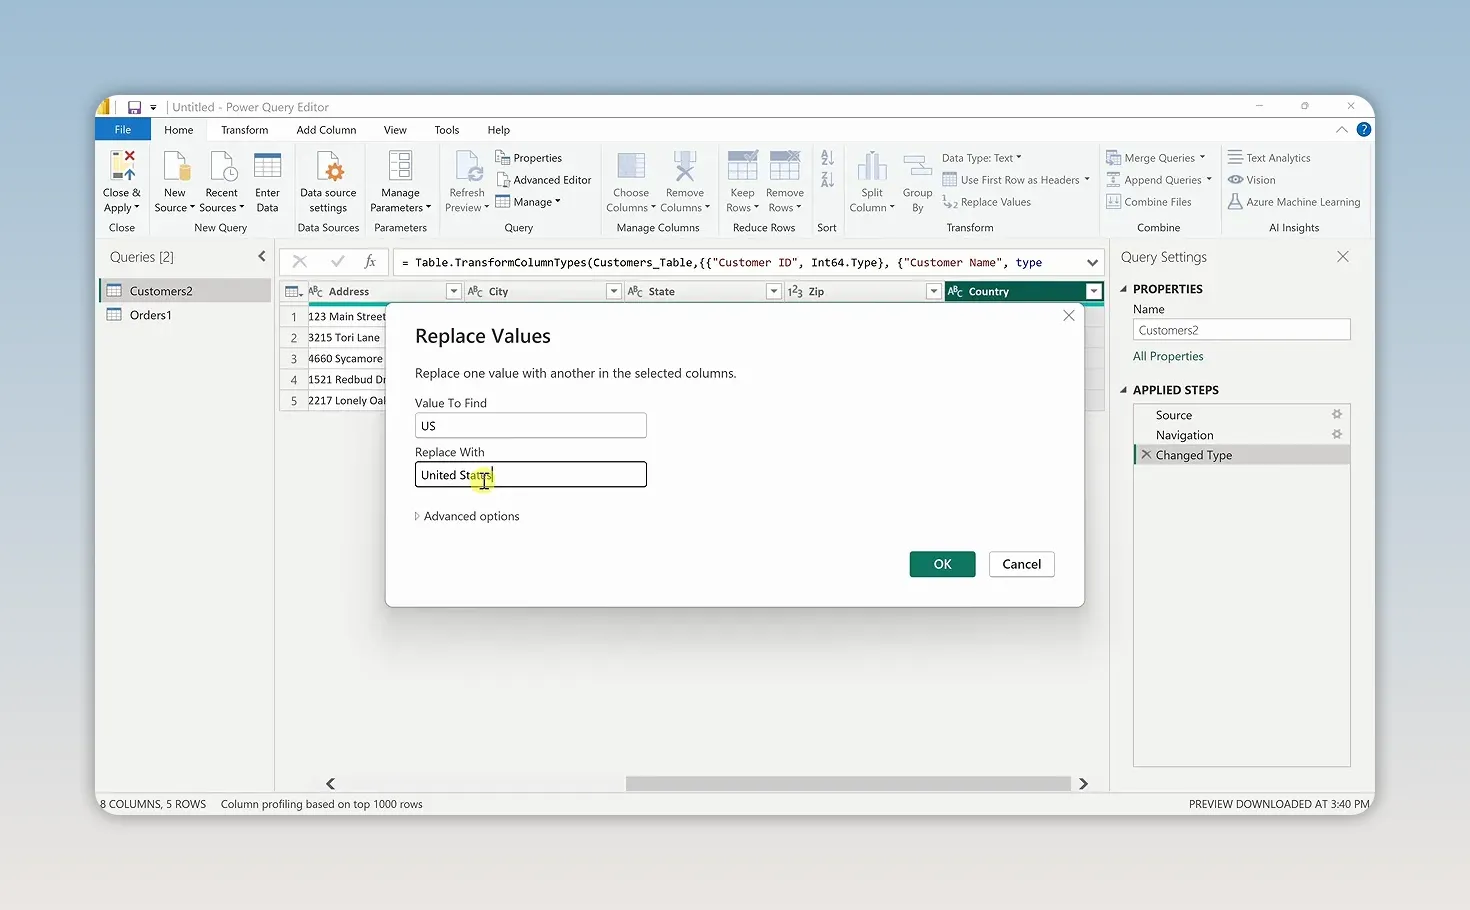
On the right, Applied Steps records the transformations you make. This is one of Power Query’s most useful features: when new data comes through the query in the future, those same steps can be applied again. You don’t have to repeat the cleanup manually each time.
Remove an Unneeded Column
- Select the Orders query.
- Select the Rush Shipment column.
- Choose Remove Columns on the ribbon.
The ribbon includes common transformations, and the Transform tab provides additional tools for modifying and cleaning data. For this report, replacing the inconsistent country label and removing the unused column are enough.
Select Home > Close & Apply to apply the changes and return to Power BI Desktop.
5. Check the Relationship in Model View
Select Model view from the navigation on the left. You’ll see the Customers and Orders tables with a line connecting them.
Power BI automatically detected a relationship because both tables contain a Customer ID field. That relationship tells Power BI how customer information corresponds to order information.
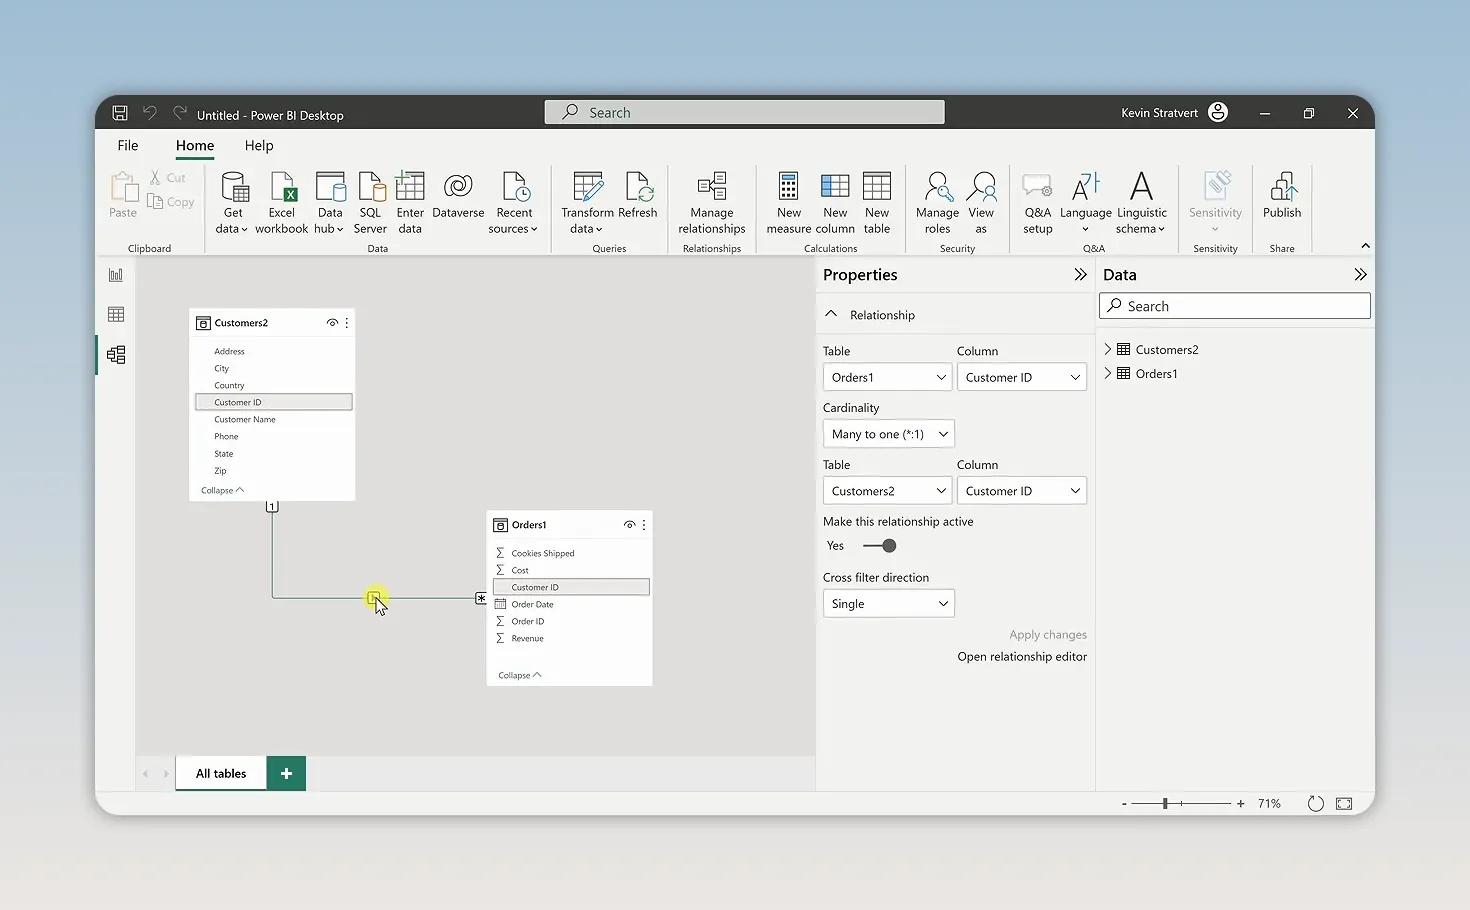
If Power BI hasn’t detected the relationship, drag Customer ID from one table onto the matching Customer ID field in the other table. Use the matching fields, not just any two columns.
This connection becomes especially useful when we add interactive filtering. A customer name comes from Customers, while shipment and revenue figures come from Orders. The relationship lets those fields work together.
For more detail about how these connections work, Microsoft’s guide to model relationships in Power BI Desktop is a useful reference.
6. Build Your Report Visualizations
Return to Report view. A report is a collection of visualizations, and the Visualizations pane offers several ways to present your data.
We’ll use three visuals, each with a specific job: a line chart for changes over time, a card for a total, and a customer list for selecting whose results we want to explore.
Create a Line Chart for Cookies Shipped
- In the Visualizations pane, select the Line chart icon.
- Expand the Orders table in the data pane.
- Drag Cookies Shipped into the chart’s Y-axis field.
- Drag Order Date into the X-axis field.
- Use the chart’s handles to enlarge it, and drag the visual to position it on the canvas.
The chart now shows shipments over time. We’ve been shipping a lot of cookies, but the daily detail makes the overall pattern a little hard to read.
Use the chart’s drill-up control to move to a higher level in the date hierarchy. A monthly view grouped by year makes the changes much easier to understand than hundreds of daily points.
Format the Chart
With the line chart selected, open Format visual. Under General, expand the title settings.
- Replace the automatically generated title with Cookies Shipped by Date.
- Adjust the title’s text color. I’ll use blue to match the Kevin Cookie Company theme.
- Explore the available visual settings as needed. The chart’s field settings also include options for a legend and a secondary Y-axis.
Click an empty area of the report canvas when you’re finished. This deselects the line chart so we can add another visual.
Add a Total Revenue Card
You don’t always have to choose a visualization before adding a field. With no existing visual selected, check Revenue in the Orders table.
Power BI makes a best guess and inserts a column chart. We only want one total, so select that new visual and change its type to Card in the Visualizations pane.
The card displays approximately 6M in total revenue. There really is money in the cookie business.
Add a Customer List
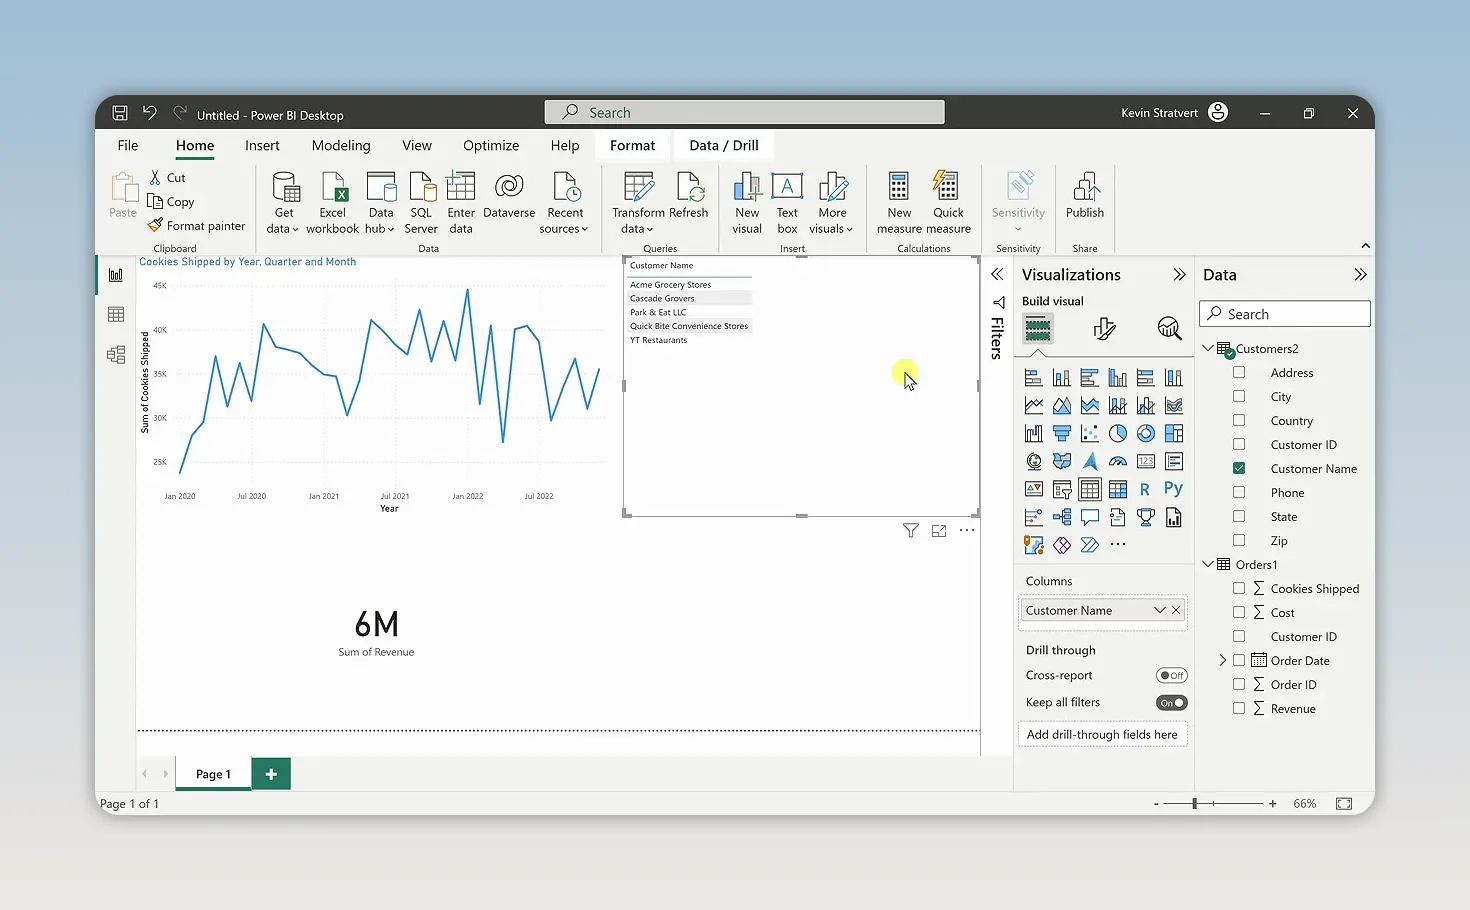
Click an empty area of the canvas again, then check Customer Name in the Customers table. Power BI creates a table visualization listing the customers.
Position it alongside the line chart and revenue card. We now have a compact report that shows shipment trends, overall revenue, and the customers behind those results.
7. Filter the Report by Customer
Here’s where the report becomes interactive. Click Acme Grocery Stores in the customer list.
The line chart and revenue card automatically update to show the selected customer’s results. Power BI can do this because we connected Customers and Orders through Customer ID.
Instead of showing all company revenue, the card now shows approximately 425K for that customer, and the chart shows its associated shipments.
To explore multiple customers together:
- Hold the Ctrl key.
- Select additional customer names in the list.
- Review the combined revenue and shipment trend.
In our example, selecting three customers brings the revenue card to approximately 4M. Click an empty area inside the customer visualization to clear the selection and return to the overall results.
This is the payoff from creating the relationship earlier: selecting a name in one table filters the related numbers in another.
8. Rename the Report Page and Add More Pages
A report doesn’t have to fit everything on one page. You can create additional pages for different views of the same data.
- Rename a page: Double-click its tab at the bottom of the report and enter a new name.
- Add a page: Click the plus icon beside the existing page tabs.
For now, our first page is ready to share with the team for feedback.
9. Publish and Share Your Power BI Report
Publishing moves the report from Power BI Desktop to the Power BI web service.
- On the Home ribbon, select Publish.
- If prompted, save your changes.
- Choose the destination workspace. For this example, select My workspace.
- Click Select.
- Once publishing succeeds, use the provided link to open the report in the web service.
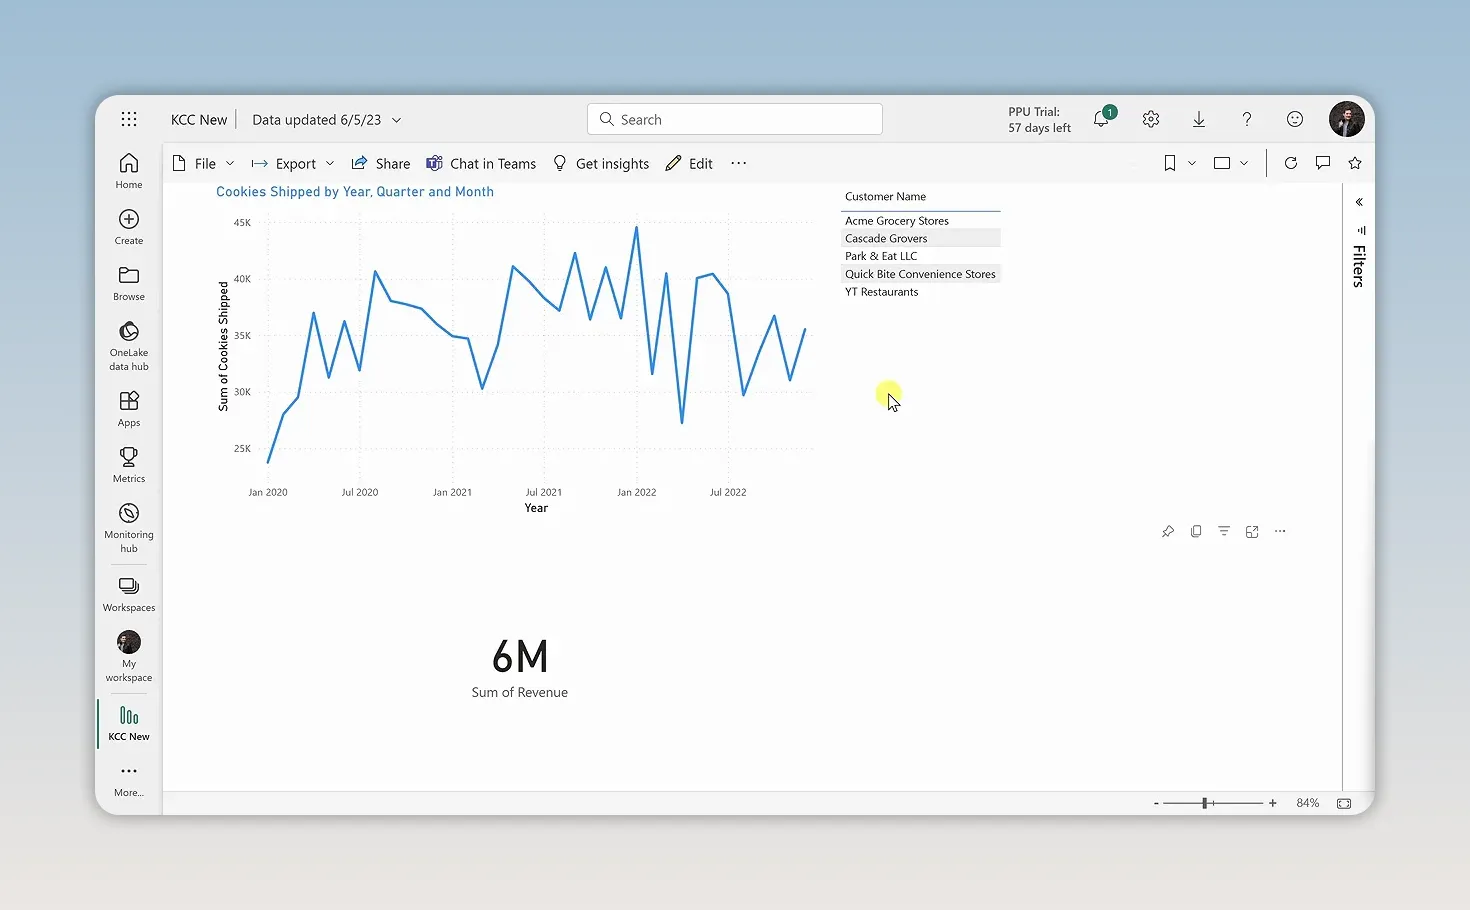
The report is now available in the browser, where the service provides several distribution options:
- Embed: The File menu includes options for placing the report on SharePoint or a website.
- Generate a QR code: Create a code that leads directly to the report page.
- Export to PowerPoint: Use the available PowerPoint options, including live data.
- Export to PDF: Create a PDF version of the report.
- Share: Enter an email address or copy a report link.
- Chat in Teams: Place the report directly into a Microsoft Teams conversation.
We’ve taken an Excel workbook, cleaned its data without changing the source, connected two tables, and built an interactive report that can be shared with others. That’s a solid foundation for using Power BI: start with a question, prepare the data, and choose visuals that make the answer easier to understand.
Made with VideoToBlog using Power BI Tutorial for Beginners


