Microsoft Power BI helps you turn business data into insights you can actually use. Instead of digging through rows of sales figures, you can build an interactive report that shows how profit changes over time, which countries perform best, and which products contribute the most to your business.
When I worked at Microsoft, I used Power BI regularly to analyze business performance and make decisions. To get started, you don’t need a complicated database or an advanced calculation. An Excel spreadsheet and a few useful questions are enough.
We’ll build a performance report for the fictional Kevin Cookie Company, starting with installation and working through importing, cleaning, combining, visualizing, and sharing data.
What You'll Learn
- Use Power Query to clean Excel data and combine it with country populations from the web.
- Build visuals that compare profit over time, across countries, and by product.
- Add slicers and visual interactions to explore different markets within one report.
- Save reports locally, publish them online, and review permissions before sharing.
Table of Contents
- 1. Download and Install Power BI Desktop
- 2. Get Familiar with the Sample Data
- 3. Import the Excel Spreadsheet
- 4. Clean the Spreadsheet Data in Power Query Editor
- 5. Import and Clean Population Data from the Web
- 6. Merge the Sales and Population Queries
- 7. Understand the Power BI Workspace
- 8. Add a Report Title and Visualizations
- 9. Make the Report Interactive with a Slicer
- 10. Apply a Theme and Format Your Report
- 11. Save and Publish the Power BI Report
- 12. Share the Report and Set Permissions
1. Download and Install Power BI Desktop
Power BI Desktop is free to download and use for creating reports on your computer. You don’t need an enterprise or commercial account simply to install it and start working with local data.
Open the Power BI Desktop download page. There are two installation approaches:
- Microsoft Store: Select the free download option to open the Store listing, then install Power BI Desktop.
- Standalone installer: Open the download or language options, choose the appropriate available installer for your system, and run the downloaded file.
I recommend the Microsoft Store option. It handles updates automatically and can download only the components that change. It also avoids requiring you to be signed in as an administrator for the installation, although your organization’s device policies may affect what you can install.
Once installation finishes, open the Start menu and search for Power BI. If you plan to use it regularly, pin it to your taskbar for quick access.
The welcome screen provides access to Get data, recent data sources, existing reports, and training resources. Get data is the important starting point: before we can build any visuals, we need something to analyze.
Power BI’s interface changes over time, so some pane names, icons, and menu locations may differ from the examples here.
2. Get Familiar with the Sample Data
For this example, download the Kevin Cookie Company financial spreadsheet.
The workbook contains sales information for several cookie products across different countries. Its fields include:
- Country and product
- Units sold
- Revenue and cost per cookie
- Total revenue, total cost, and profit
- Date, month, and year
That gives us enough information to answer questions such as: How has profit changed over time? Which country generates the most profit? Are chocolate chip cookies doing better than fortune cookies?
We’ll also bring in country population data from Wikipedia’s list of countries and dependencies by population. Combining population with sales gives us additional context about the markets where the company operates.
The sales data happens to be in Excel, but Power BI is not limited to spreadsheets. The Get data dialog includes connectors for sources such as SQL databases, web pages, and Azure Data Explorer, which uses Kusto queries.
3. Import the Excel Spreadsheet
- Select Get data.
- Choose Excel, then select Connect.
- Browse to the downloaded workbook and open it.
- In the Navigator, select the Cookie Sales worksheet.
The Navigator may show both a named financials table and the Cookie Sales worksheet. In this particular workbook, the worksheet contains just that one table, so either selection provides the same underlying sales records. That won’t necessarily be true for other workbooks.
Once you select an item, Power BI displays a preview. At this point, you have two choices:
- Load: Bring the data directly into Power BI.
- Transform Data: Open Power Query Editor so you can clean and shape the data first.
Choose Transform Data. We have a few changes to make before building the report.
4. Clean the Spreadsheet Data in Power Query Editor
Power Query Editor is where you prepare your data for analysis. You can filter records, change data types, rename columns, remove unnecessary information, and combine sources.
Think of it as getting your ingredients ready before baking. You could skip the preparation, but the result probably won’t be as good.
Filter a Product
Suppose the Kevin Cookie Company has decided to discontinue fortune cookies because they generate relatively little profit and distract from the other product lines.
To exclude them from an analysis:
- Open the filter dropdown on the Product column.
- Clear the checkbox for Fortune Cookie.
- Select OK.
The preview now excludes those records. This demonstrates how you can narrow an analysis before loading the data.
Change Units Sold to Whole Numbers
The sample data includes decimal values in Units Sold. For this example, we want to work with whole cookies rather than fractional cookies.
Right-click the Units Sold column, select Change Type, and choose Whole Number.
This changes how the values are represented. In a real analysis, make sure the conversion fits the meaning of your data, rather than using a data-type change to hide a source-data issue.
Rename a Column
The column name Month Name can be a little more concise. Double-click its header and rename it Month.
Review and Remove Applied Steps
As you make changes, Power Query records them in the Applied Steps section on the right. Select a step to inspect the data at that point in the process.
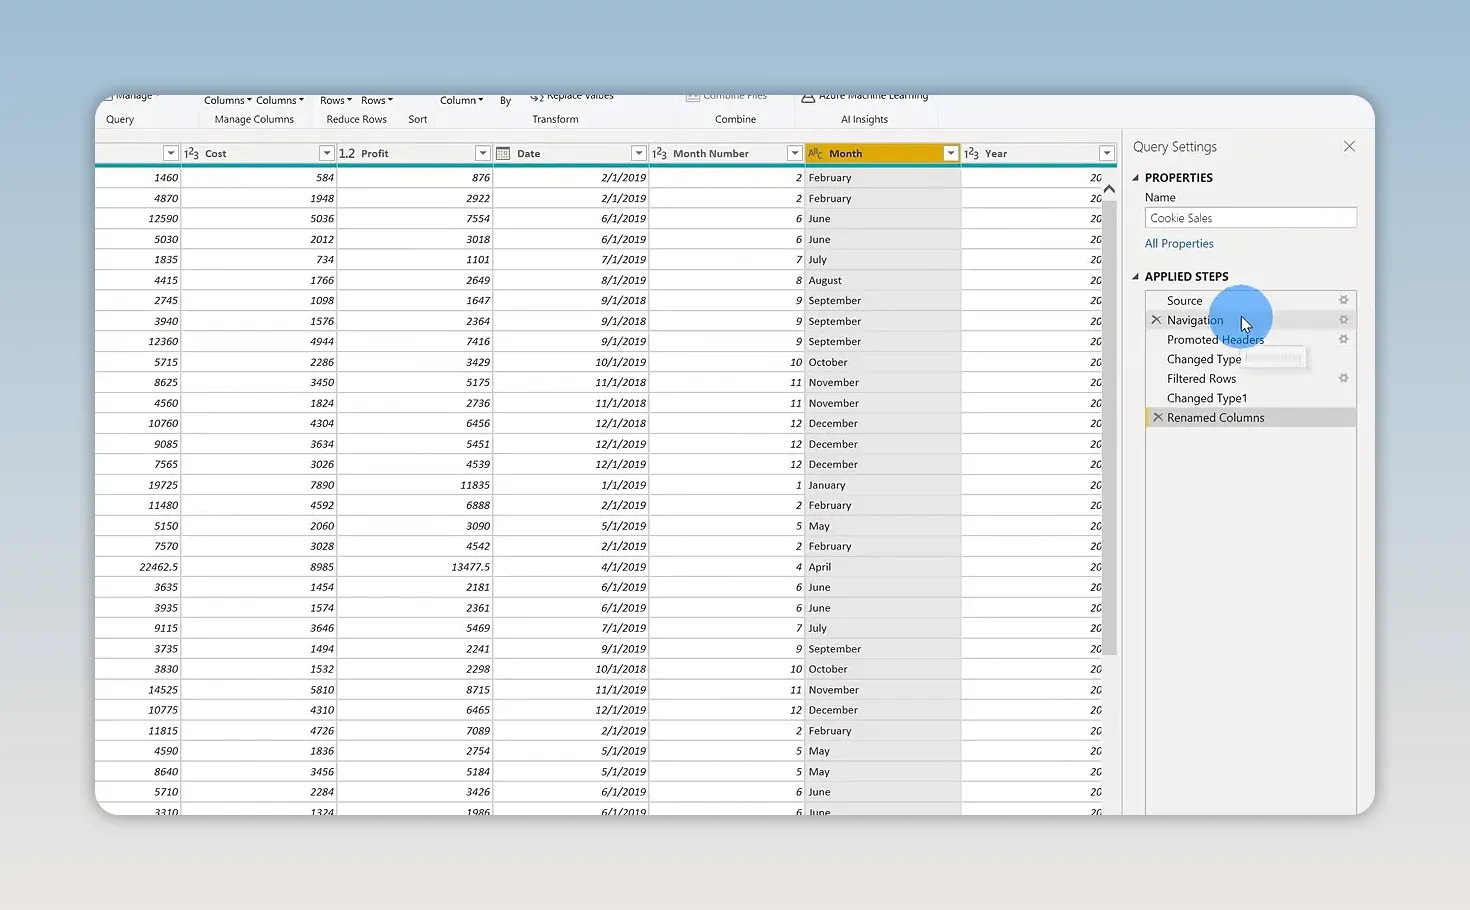
Now, on second thought, fortune cookies were part of our historical sales. We should keep them in the performance report so we can compare them with the other products.
Find the Filtered Rows step that removed fortune cookies and use the X beside it to delete that transformation. The fortune cookie records return, while the other transformations remain.
You don’t have to start over when you change your mind. Applied Steps gives you a way to revisit the preparation process.
5. Import and Clean Population Data from the Web
While still in Power Query Editor, select New Source > Web. Paste the Wikipedia population-page address linked earlier and select OK.
Power BI opens a Navigator showing the elements it can detect on that page. Select the table containing country names and population figures. In this example, it is labeled Sovereign states and dependencies.
This is a useful capability: a structured table on a web page can become a data source without manually copying and pasting it into Excel.
After importing the table, clean it up:
- Rename the query Country Populations.
- Remove columns you don’t need, such as rank, percentage of world population, date, and source.
- Keep the country name and population columns.
- Filter the country column to the company’s five markets: Canada, France, Germany, Mexico, and the United States.
- Use Replace Values to remove any footnote markers attached to country names.
In the example data, the United States and France have extra footnote text that needs removing. The exact markers may change as the web page is updated.
The country names need to match the names in the sales data. An extra character can prevent Power BI from finding the corresponding country when we combine the sources.
6. Merge the Sales and Population Queries
We now have two queries: one for cookie sales and another for country populations. The shared field is the country name.
- Select the Cookie Sales query.
- Choose Merge Queries.
- Select the country column in the sales preview.
- Choose Country Populations as the second query.
- Select its country-name column.
- Check the match information, then select OK.
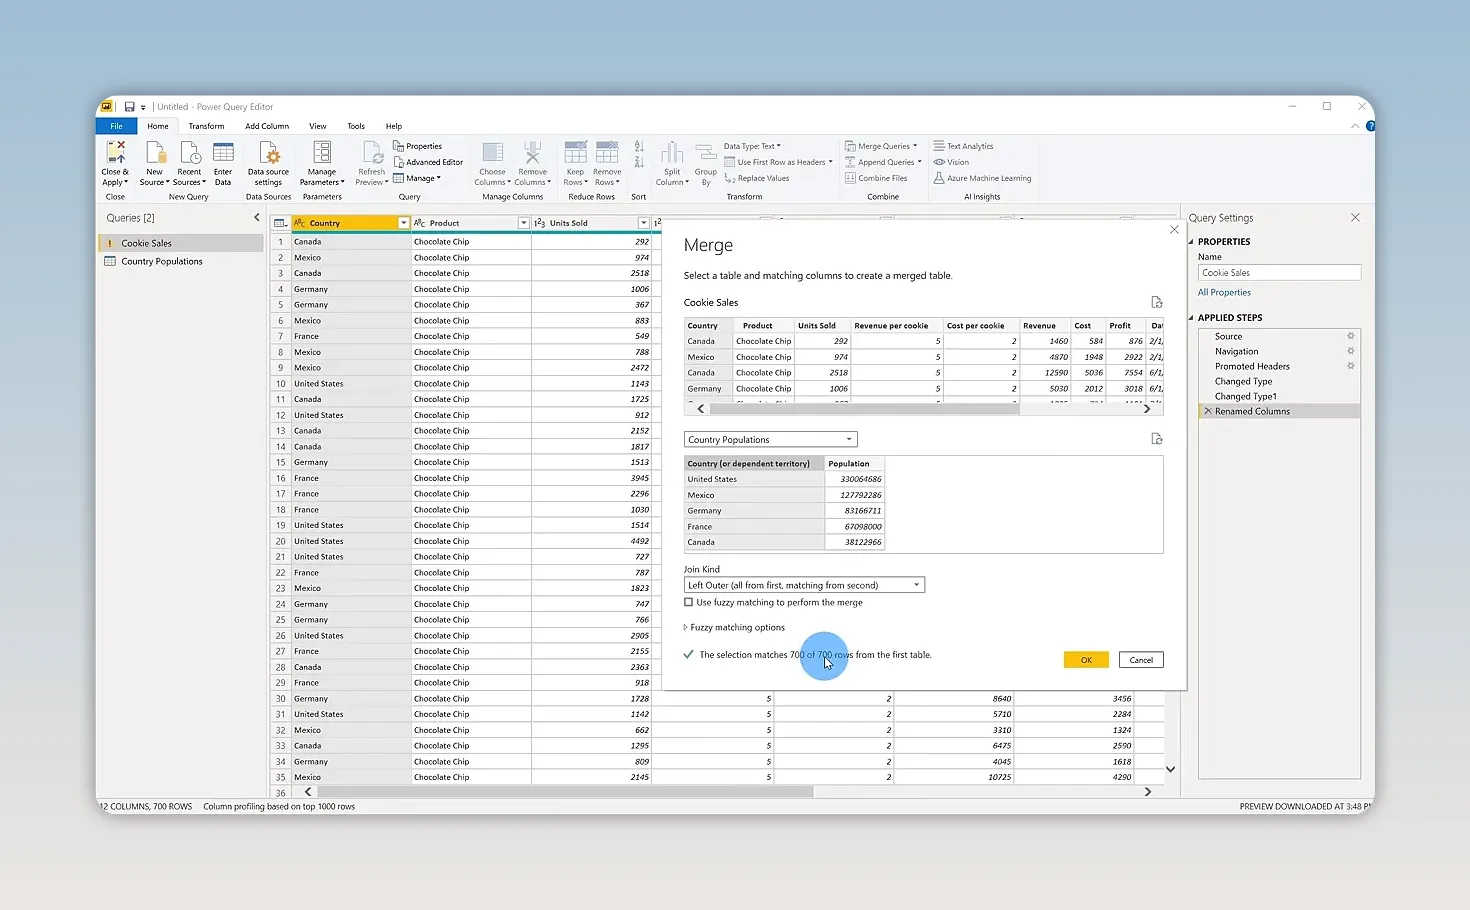
If Power BI asks about privacy levels, choose settings appropriate for your sources. This example uses fictional business data and a public web page. Don’t ignore privacy protections when combining sensitive business information with other sources.
Every sales row should find a matching country. If some rows don’t match, check the country names for spelling differences, footnotes, or other extra text.
The merge adds a new column containing the matching records. Select the expand icon in that column’s header, choose Population, and confirm.
Each sales row now includes the population of its country. Select Close & Apply to apply the transformations and return to Power BI Desktop.
One important distinction: merging queries adds data to a query, while a model relationship connects separate tables. They are related ideas, but they are not the same operation.
7. Understand the Power BI Workspace
After loading the data, Power BI opens a blank report canvas. Here are the main areas you’ll use:
- Report canvas: The central area where you arrange charts, maps, text, and other visuals.
- Fields pane: The available tables and columns you can use to build visuals.
- Visualizations pane: The visual types and field assignments for the selected visual.
The left-side navigation lets you switch between three useful views:
- Report view: Build and arrange your report.
- Data view: Inspect the loaded data after your transformations have been applied.
- Model view: Inspect tables and relationships between them.
In Model view, a relationship line shows how two tables connect. Selecting or hovering over a connection helps identify the columns involved, such as the country fields in this example.
8. Add a Report Title and Visualizations
Start by giving the report some context. Insert a Text box, enter Kevin Cookie Company Performance Report, increase the font size, and stretch the box across the top of the canvas.
Now we can add visuals that answer specific business questions.
Show Profit over Time with a Line Chart
- Click a blank area of the canvas.
- Select Profit in the Fields pane.
- Select Date.
- Change the visual type to Line chart.
Power BI chooses a default visual when you select fields, but you can change that choice at any time.
The Date field may initially use a Date hierarchy, grouping the data by year. In the sample, annual profit is approximately $650,000 for 2018 and just over $2 million for 2019. Hover over a data point to see its exact value.
To show the individual dates rather than the default yearly grouping, open the Date field’s dropdown in the visual’s field assignments and switch from Date hierarchy to Date. With this monthly sample data, the chart now shows the month-by-month trend.
Check that Date is assigned to the axis and Profit to the values. You can also adjust field assignments, add a legend, or use other available field wells as needed.
Compare Profit by Country on a Map
- Click a blank area of the canvas.
- Select Country.
- Choose the Map visual if Power BI does not select it automatically.
- Drag Profit onto the map’s size or value field.
The map places markers on the company’s countries, with larger bubbles representing more profit.
In the sample, the United States, Canada, and France have broadly similar profit levels, while Germany and Mexico have smaller bubbles.
You can switch the same visual to a Treemap to compare countries using differently sized rectangles. Try both and choose the one that communicates the comparison most clearly. For this report, I’ll keep the map.
Display Country, Population, and Units Sold
Next, insert a Table visual and add Country, Population, and Units Sold. Reorder the fields so Country appears first.
You can create a blank visual first and then add fields, or select fields first and change the visual type afterward. Both approaches work.
Be careful with population aggregation. The merged sales query repeats a country’s population on multiple sales rows, so adding those repeated values together would overstate the population. Use the country-level population data or an appropriate aggregation so each country displays its population once.
This comparison also sets up a possible next step: calculating cookies sold per person. That calculation goes beyond this introduction, but it shows why bringing additional context into your model can be useful.
Compare Profit by Product
- Click a blank area of the report.
- Select Product and Profit.
- Choose a Bar chart.
The result makes product performance easy to compare. In the sample data, chocolate chip cookies generate the most profit, while fortune cookies generate the least.
That’s exactly why keeping fortune cookies in the historical analysis was useful. We can now see how they compare rather than simply removing them from the story.
9. Make the Report Interactive with a Slicer
A collection of charts is useful. A collection of charts that you can filter together is even better.
- Click a blank area of the canvas.
- Insert a Slicer.
- Drag Country into the slicer’s field.
- Select a country, such as the United States or Mexico.
The report’s visuals adjust to the selected market. You can quickly compare its profit trend, units sold, population, and most profitable products.
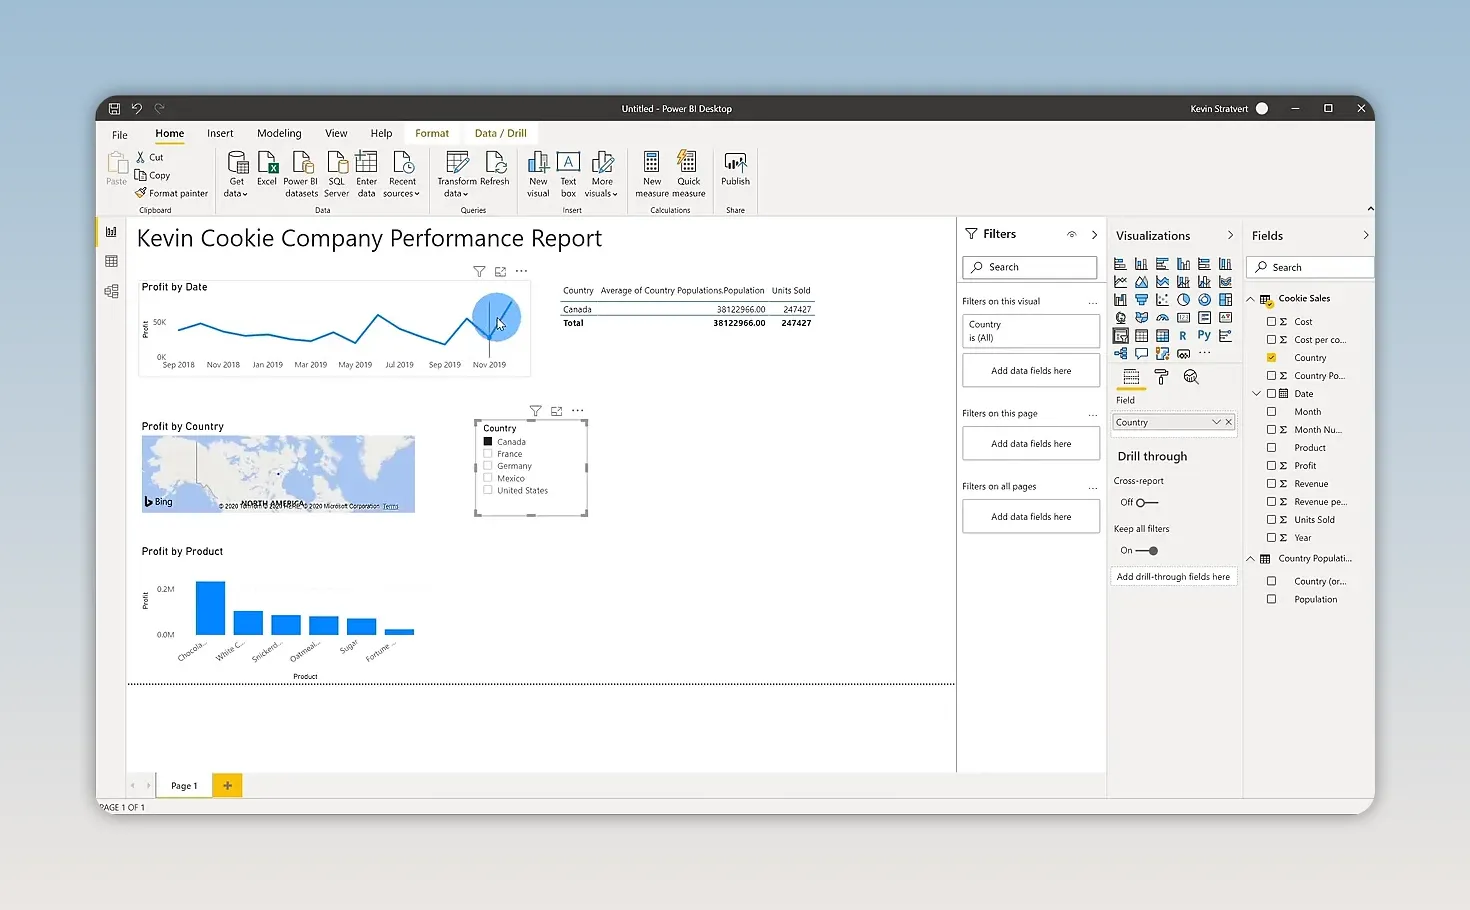
You can also interact directly with the visuals. Select a country bubble on the map or a country row in the data visual to filter or highlight related information elsewhere in the report.
To clear a map selection, click an empty area of the map, such as the Atlantic Ocean. Clearing a visual selection restores the broader comparison, provided another filter or slicer is not still limiting the data.
10. Apply a Theme and Format Your Report
Once the report answers the right questions, spend a little time making it easier to read.
Open View > Themes and choose a theme. I use the Executive theme in this example to change the report’s colors.
For individual adjustments:
- Select a visual.
- Open its Format options in the Visualizations pane.
- Expand the setting you want to change, such as Title.
- Adjust the text size or other available properties.
For example, increasing a chart title to 20 points can make it stand out. Use the same formatting controls to align the report with your company’s colors and overall look.
You can also move and resize visuals, add report pages, and rename pages. A single page works well for this introductory performance report, but you have room to expand it as your questions become more detailed.
11. Save and Publish the Power BI Report
To save your work locally, select File > Save As, choose a location, and name the file Kevin Cookie Company Report. The report is saved as a .pbix file.
You can continue using that file on your own to analyze data and create different views. To make the report available online, publish it to the Power BI service:
- Select File > Publish > Publish to Power BI.
- Save any pending changes.
- Choose a destination, such as My workspace.
- Wait for the success message.
- Use the provided link to open the report in the Power BI service.
The browser-based report retains its interactivity. You can select countries and explore the data much as you did in Power BI Desktop.
Creating reports in Desktop and sharing them through the online service are separate capabilities. Online sharing depends on your account, license, workspace, and organizational settings. Microsoft’s report-sharing documentation explains the requirements.
12. Share the Report and Set Permissions
In the Power BI service, open the report and select Share.
The sharing options let you specify who should have access and what they can do. Depending on the available settings, you can:
- Enter individual email addresses to grant access.
- Allow recipients to share the report with others.
- Allow recipients to create new content using the underlying data.
- Send an email notification about the shared report.
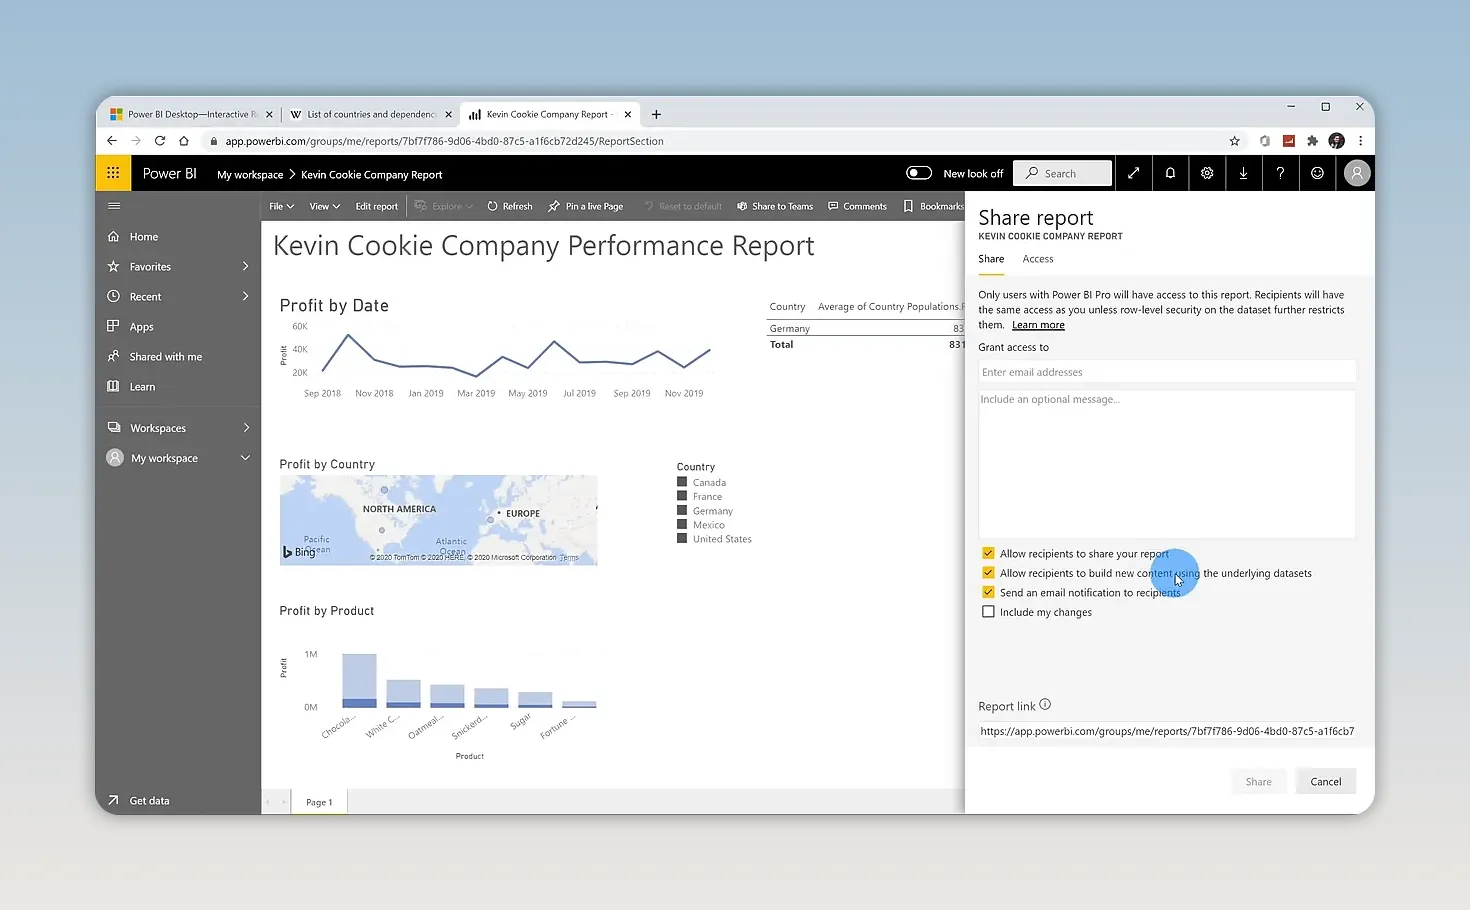
Take a moment to review those permissions. Giving someone access to interact with a report is different from allowing them to redistribute it or build new content from its underlying data.
We’ve now gone from an Excel spreadsheet and a web-based population source to a cleaned, combined, interactive business report. More importantly, the report answers useful questions: how profit changes over time, which markets perform best, and which cookies contribute the most.
That’s the basic Power BI workflow: connect to data, prepare it, build visuals, explore the results, and share the insights. You can use that same process with your own business data, one question at a time.
Made with VideoToBlog using How to use Microsoft Power BI - Tutorial for Beginners


